


A good subscription revenue forecast starts with the recurring revenue you already have, then adds new customers, expansion, contraction and churn as separate drivers, month by month. It is built bottom-up from those drivers, not top-down from a growth target. It also keeps two things apart that founders often blur: cash collected and revenue recognised. This guide shows how to build it, which mistakes investors spot first, and where UK accounting rules change the numbers.
TL;DR
- Forecast from drivers (new logos, expansion, contraction, churn), not from a target growth rate. Every figure should trace to an input you can sensitivity-test.
- Model churn by cohort, not as one blended percentage. Early-life churn is usually much higher than later churn.
- Keep MRR and ARR (management metrics) separate from recognised revenue and cash. Annual upfront payments are deferred revenue under UK standards.
- Link the forecast to unit economics (CAC payback, gross margin, LTV), so a change in retention shows up in your runway.
- Build three scenarios and be ready to explain every assumption in due diligence.
Table of Contents
- What a subscription forecast actually predicts
- Why top-down forecasts fail
- The MRR waterfall: the core of the model
- Model churn by cohort, not as one average
- Forecast revenue, then cash, then recognised revenue
- Link the forecast to unit economics
- A step-by-step build
- Mistakes we see that investors notice
- Our perspective
- Where we can help
- FAQ
- Sources
What a subscription forecast actually predicts
There are three numbers people loosely call “revenue”, and a forecast that mixes them will mislead you.
- Recurring revenue (MRR or ARR): the run-rate of your contracted subscriptions. This is a management metric.
- Recognised revenue: what appears in your profit and loss account under FRS 102 or IFRS 15.
- Cash: what lands in the bank, which depends on billing terms and payment behaviour.
The difference matters more than most founders expect. ARR has no definition in accounting standards and nobody audits it, so each company decides what counts. Only revenue in audited statutory accounts is truly comparable between businesses. When you show an investor a forecast, state your MRR definition (are usage fees in? one-off fees out? signed but not live contracts?) and keep it the same across periods.
Why top-down forecasts fail
The quickest forecast is last year’s revenue multiplied by a hoped-for growth rate. It is also the one that fails first under scrutiny. A real SaaS financial model works the other way round: it starts from the inputs that drive revenue, such as acquisition rate, conversion, churn and expansion, and builds outwards.
The practical test is simple. Investors scrutinise models where every KPI is an explicit, traceable input that can be sensitivity-tested. If you cannot point from a number in your dashboard to a specific driver in your model, expect that gap to surface in diligence.
The MRR waterfall: the core of the model
The backbone of any recurring revenue forecast is the MRR waterfall. For each month:
Ending MRR = Starting MRR + New MRR + Expansion MRR − Contraction MRR − Churned MRR
This is the formula used in cohort-based SaaS models, and each component must be a distinct driver, not a plug.
| Component | What drives it | Where the input comes from |
|---|---|---|
| Starting MRR | Last month’s ending MRR | Billing system, reconciled to the ledger |
| New MRR | Leads, conversion rate, average contract value | Pipeline data and sales capacity |
| Expansion MRR | Upgrades, extra seats, price rises | Customer success and pricing plans |
| Contraction MRR | Downgrades, seat reductions | Billing history |
| Churned MRR | Cancellations and non-renewals | Cohort retention curves |
A worked example
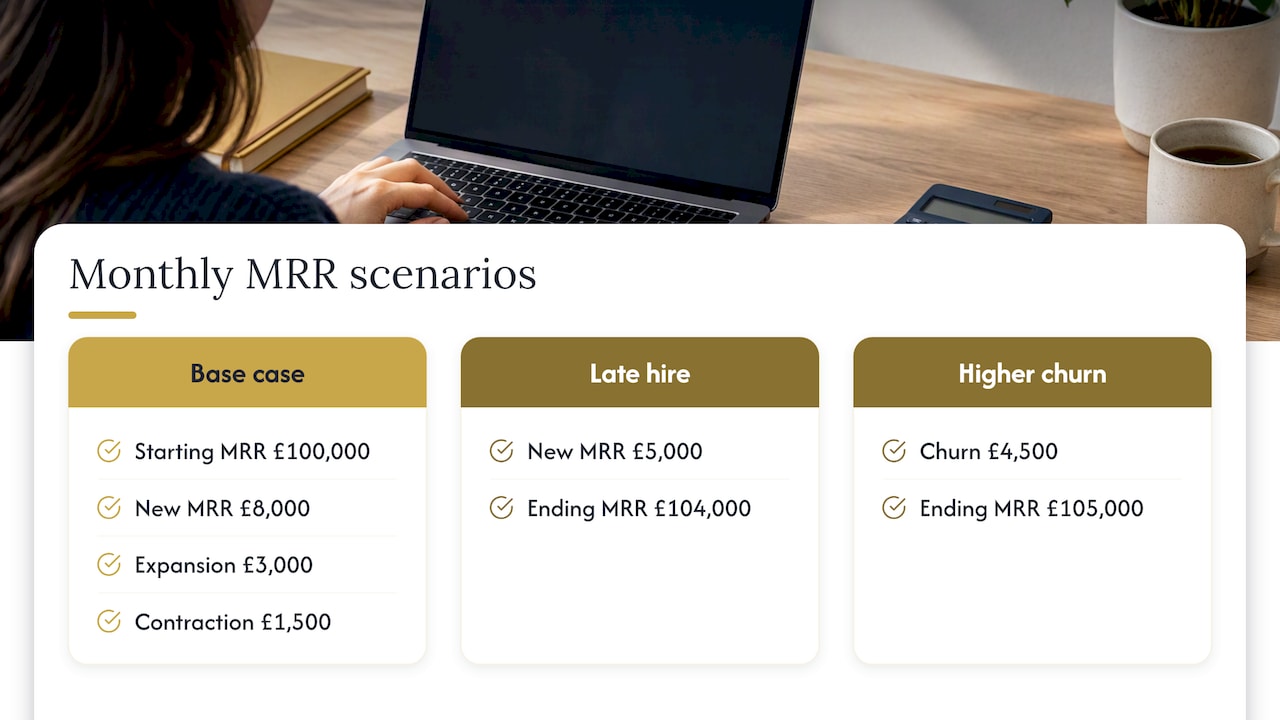
Suppose you start the month at £100,000 MRR. You expect £8,000 of new MRR, £3,000 of expansion, £1,500 of contraction and £2,500 of churn.
Ending MRR = 100,000 + 8,000 + 3,000 − 1,500 − 2,500 = £107,000.
That is 7% net growth in the month. The useful part is what you can now ask: if new MRR slips to £5,000 because a sales hire starts late, ending MRR is £104,000. If churn rises to £4,500, it is £105,000. Each driver can be moved independently, which is what a top-down growth rate cannot do. The figures are illustrative, not benchmarks.
Model churn by cohort, not as one average
A single blended churn rate is the most common weakness in early SaaS models. The more robust approach is a cohort-based revenue waterfall, which tracks each customer vintage separately, because churn is typically highest in the first one to six months and settles after that.
Why it matters in practice:
- If you are growing fast, most of your base is young, so a blended rate understates how your churn will behave as the base ages, and overstates it for mature cohorts.
- Different acquisition channels or pricing plans often retain differently. Cohorts let you see that.
- Expansion usually concentrates in certain cohorts. Modelling each vintage with its own retention and expansion assumptions is what investors expect to see.
If you have fewer than a year of data, say so, and use ranges rather than a false-precision curve. We cover the mechanics in more depth in our guides to SaaS cohort analysis for retention and cohort tables covering retention, expansion and payback.
Read churn as a signal, not just a number
High churn is rarely just a pricing issue. It often points to poor user experience, weak product-market fit or overselling, and investors will drill into those during due diligence. Your forecast should therefore carry a reason for every churn assumption, not only a percentage.
Forecast revenue, then cash, then recognised revenue
Once MRR is built, convert it into the two other views.
Cash
Billing terms change everything. A customer on a £12,000 annual contract paid upfront gives you £12,000 in the bank in month one. A customer paying monthly gives £1,000. Two companies with identical MRR can have very different runways. Model billing frequency by cohort, add payment delays, and include a bad-debt allowance.
Recognised revenue
Under FRS 102 (Section 23) and IFRS 15, upfront cash from annual subscriptions is treated as deferred revenue, a liability, and recognised ratably as the service is delivered. The £12,000 above becomes £1,000 of revenue a month for twelve months.
Implementation or onboarding fees need a judgement. Where they are not distinct from the subscription, they are typically deferred and recognised over the life of the customer relationship, not when the setup finishes. Your accountant should confirm the treatment for your contracts before you put the figures in an investor model.
A forecast that ties MRR, deferred revenue, recognised revenue and cash together on one balance sheet is far easier to defend than three disconnected spreadsheets.
Link the forecast to unit economics
A model that stops at MRR or ARR is only half finished. To be investor-ready, revenue drivers should link explicitly to unit economics such as CAC payback, LTV and the Magic Number, so a change in retention flows through to your capacity to scale.
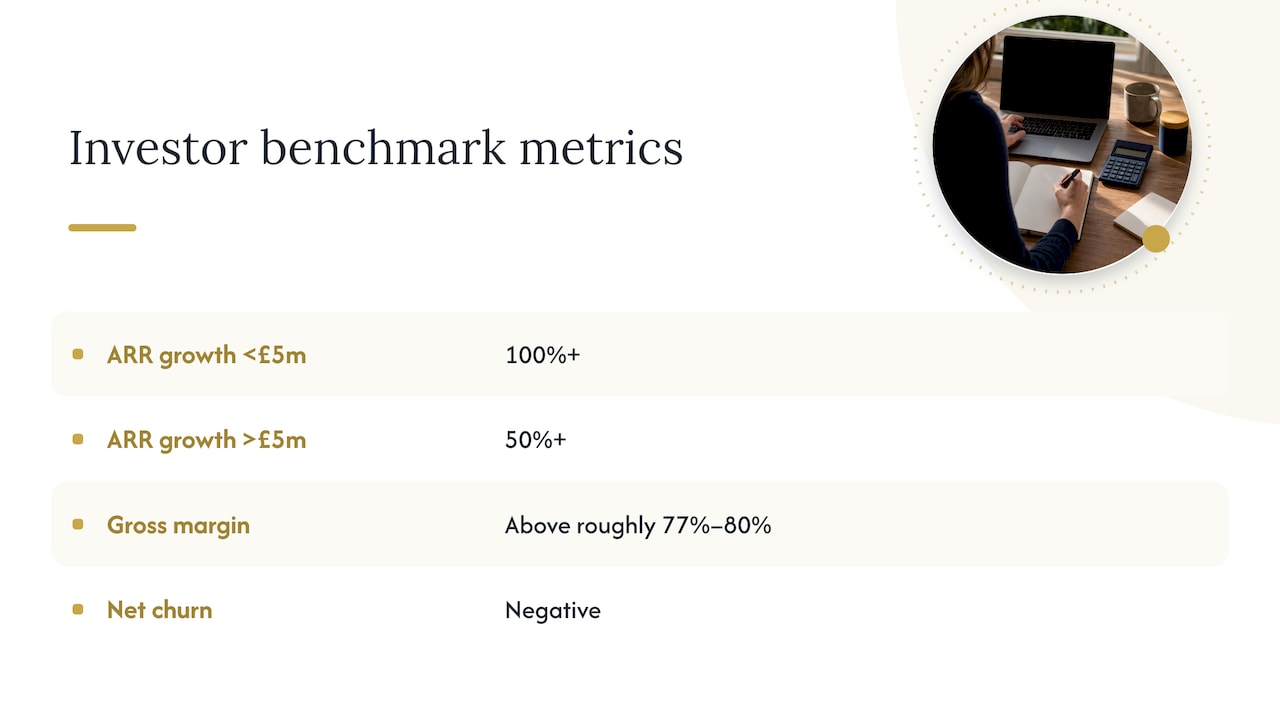
For context on what UK investors look at, one UK venture investor’s SaaS guide benchmarks strong ARR growth at 100%+ for companies under £5m revenue and 50%+ above that. It also expects gross margin above roughly 77% to 80% and negative net churn, where expansion outweighs lost revenue. Treat these as reference points for stress-testing your own assumptions, not targets to copy. Our SaaS financial benchmarks for 2026 and unit economics guide go through the ratios in detail.
When you set growth assumptions, it also helps to see what investors in your wider market are backing. If your product is app-based, this shortlist of UK mobile app investors is a useful way to sense-check how fast your forecast needs to grow to be fundable.
A step-by-step build
- Clean the data. Reconcile billing-system MRR to the ledger. Agree one MRR definition and write it down.
- Split customers into cohorts by start month, and where useful by plan or channel.
- Set drivers per cohort: retention curve, expansion rate, contraction rate, billing frequency.
- Forecast new business from capacity, not ambition: leads, conversion, sales headcount, ramp time, average contract value.
- Build the waterfall monthly for at least 24 months, quarterly beyond that if needed.
- Convert to cash and recognised revenue, with deferred revenue on the balance sheet.
- Add costs and unit economics: gross margin, CAC, payback, burn.
- Run three scenarios (base, downside, upside) and a sensitivity table on churn, conversion and price.
- Back-test. Compare last year’s forecast with actuals and note why each variance occurred.
Mistakes we see that investors notice
- Counting signed contracts as live MRR before go-live, which overstates both MRR and cash.
- One churn rate for everyone, hiding a weak first-six-months cohort.
- Recognising annual upfront payments as revenue when received, which breaks the link to statutory accounts.
- Hard-coded outputs. If a cell is typed over, the sensitivity analysis is meaningless.
- Growth rate pasted in from a target. The model then confirms the answer you wanted rather than testing it.
- No reconciliation to actuals, so nobody knows whether the model has ever been right.
Our perspective
Most founders who come to us do not have a bad forecast. They have a forecast nobody can explain. The spreadsheet was built for a board meeting, the churn rate was a round number, and the revenue line cannot be reconciled to the accounts.
We approach it the way a finance director would. We start from the ledger, agree the definitions, and build each driver so a sceptical investor can trace it. As ICAEW Chartered Accountants, we care that the model reconciles to what your statutory accounts will show, because that is where diligence ends up. The forecast is also a management tool: when a hire, a price change or a churn spike can be tested before it happens, the numbers earn their keep.
Our view is that a forecast should be slightly humble. Show ranges, show what would have to be true for the upside case, and be explicit about what you do not yet know. That is more credible than a smooth curve.
— Kishen Patel
Where we can help
If your forecast needs to stand up to investors or a buyer, our investor-grade financial modelling service builds driver-based, cohort-level models linked to your accounts. For ongoing reporting and planning, our FP&A services keep the forecast current. If you lack senior finance leadership while you scale, fractional CFO services give you that level of oversight without a full-time hire. You can also see how forecasting links pipeline to cash, runway and hiring.
FAQ
What is the best method for forecasting subscription revenue?
A bottom-up MRR waterfall with cohort-level churn is the most defensible. It treats new, expansion, contraction and churned revenue as separate drivers, so you can test each one. A single blended churn rate is quicker but hides how young cohorts behave.
How far ahead should a SaaS revenue forecast go?
Most investor models run monthly for 24 to 36 months. Beyond the first 12 months, label assumptions as lower confidence and show scenarios. Your own operating forecast, used for hiring and cash, is often a rolling 12 to 18 months.
Is ARR the same as revenue?
No. ARR is a management metric with no accounting-standard definition, whereas revenue is what is recognised in your statutory accounts. Annual upfront payments sit in deferred revenue and are released over the contract term, so ARR and recognised revenue will differ at any point in time.
How accurate can a subscription forecast be?
Starting MRR is known, so near-term months can be quite reliable. Accuracy falls as you rely on new-business and churn assumptions further out. The fix is not a more complicated model but regular back-testing against actuals and honest ranges.
Sources
- SaaS Financial Model Template: Free Download, Fairview
- Model SaaS Revenue, Churn & Expansion for Investors
- SaaS Revenue Recognition: A Guide with Examples, Sage
- SaaS investor guide, AlbionVC (PDF)
- UK SaaS Company Database: Revenue Figures You Can Check, Idea London
Recommended
- Revenue Recognition for UK Startups, Traps Guide 2025
- SaaS Forecasting 2026: Pipeline to Cash, Runway, Hiring
- SaaS Financial Due Diligence in the UK: The Ultimate Guide
- SaaS Valuation 2026, UK Guide to ARR Multiples
This article is for general information only and is not professional advice.
Not sure where your business stands right now?
Book a free 30-minute call with Kish. Bring your numbers, your questions, or just your situation. You will leave with a clearer picture than you arrived with.
Book a Free Strategy Call
Over 12 years across Big Four audit, Investment Banking, and corporate advisory. Kish works with SaaS founders, tech companies, and ambitious UK SMEs from £1M to £50M in revenue on fundraising, valuations, exit planning, and financial strategy. ICAEW regulated. Big Four trained. Based in London.