

The main churn analysis methods are a correctly calculated churn rate, cohort analysis, customer segmentation, a comparison of churned and retained accounts, exit and customer interviews, and predictive modelling. Each answers a different question. The rate tells you how much you are losing, cohorts tell you when, segments tell you where, and interviews and behavioural data tell you why. Used together, they turn a single worrying percentage into a retention plan.
This guide walks through each method in the order we would apply it for a UK SaaS or subscription business, with worked examples, the data you need and the mistakes that make churn look better or worse than it really is.
TL;DR
- Decide first whether your customers are contractual (cancellation is visible) or non-contractual (they just stop buying). That choice defines what counts as churn.
- Calculate customer churn and revenue churn separately, on a fixed opening cohort, and annualise monthly churn by compounding, never by multiplying by 12.
- Cohorts show when customers leave, segments show which customers leave, and comparing leavers with stayers shows what actually differs.
- Interviews explain the reasons, behavioural data shows what happened beforehand. You need both.
- A churn model is only worth building if its predictions trigger actions you can measure.
Table of Contents
- Start by defining what counts as churn
- Method 1: calculate churn rate properly
- Method 2: separate customer churn from revenue churn
- Method 3: cohort analysis
- Method 4: customer segmentation
- Method 5: compare churned and retained customers
- Method 6: interviews and exit surveys
- Method 7: predictive churn modelling
- Which method answers which question
- Using the analysis to reduce churn
- Why buyers and investors care how you measured it
- Our perspective: churn is a finance problem as much as a customer one
- Getting senior finance support on your churn numbers
- FAQ
- Sources
Start by defining what counts as churn
Customer churn is the loss of existing customers for any reason over a given period, as IBM’s overview of customer churn puts it. Before you run any analysis, make three distinctions.
Voluntary and involuntary churn. A customer who cancels has made a decision. A customer whose card fails has not. They need different fixes: the first is a product, price or service problem, the second is a billing and dunning problem. Mixing them hides both.
Customer churn and revenue churn. Losing ten small accounts is not the same as losing one large one. Track both, which we cover below.
Contractual and non-contractual relationships. A 2025 peer-reviewed survey of customer churn research stresses that this setting determines what counts as churn and which analytical approach is valid. In a subscription, cancellation is observable. In a non-contractual business, such as an online shop, disengagement is latent and you have to infer it. That makes modelling harder and the definition of a lapsed customer a judgement you must write down.
Write your definition into your metrics pack: what triggers churn, how long a payment gap can last before the account counts as lost, and how paused or downgraded accounts are treated. Without that, two people in the same company will report different numbers.
Method 1: calculate churn rate properly
The basic formula is customers lost during the period divided by customers at the start of the period. Metabase’s churn guide recommends a fixed starting cohort and excluding new sign-ups from the calculation. ChartMogul makes the same point for B2B subscriptions: take the customers present at the start and count how many dropped off by the end, ignoring anyone acquired in between.
A worked example, using illustrative figures:
- Customers on 1 March: 400
- Of those, cancelled by 31 March: 20
- Customer churn rate: 20 ÷ 400 = 5%
The 60 new customers you signed in March do not enter the calculation. If they did, growth would mask the losses.
Choose the period deliberately
Amplitude’s guide suggests basing the period on the product’s natural usage interval and looking at several timeframes to see short and long-term trends. ZoomInfo’s guide notes that monthly churn is common in SaaS while annual tracking is typical for longer contracts. Match the period to how you bill and how often you make decisions.
Annualise by compounding
A 5% monthly churn rate is not 60% a year. Using the compounding formula that ZoomInfo gives, 1 − (1 − monthly churn)^12, the annual figure is 1 − 0.95^12, which is roughly 46%. That is still alarming, but it is the honest number. Investors and buyers will do this sum themselves, so do it first.
Do not blend plans with different lengths
ChartMogul warns that combining annual and monthly plans can artificially lower the reported rate, because annual customers may simply not come up for renewal in the period you measure. Report churn by plan, or at least separate monthly from annual contracts.
The data you need
According to Metabase, the core fields are subscription start dates, cancellation or expiry timestamps, cancellation reason or type, and a monthly MRR model. If your billing system does not record a cancellation reason, add one now. It costs nothing and every later method depends on it.
Method 2: separate customer churn from revenue churn
Revenue churn uses MRR at the start of the period as its denominator. As ChartMogul describes it, it excludes purchases by new customers and reflects expansion, contraction and cancellation. Continuing the illustration:
- MRR on 1 March: £40,000
- MRR lost from cancellations: £1,800
- MRR lost from downgrades (contraction): £600
- MRR gained from upgrades (expansion): £1,200
Gross revenue churn is (£1,800 + £600) ÷ £40,000 = 6%. Net revenue churn is (£2,400 − £1,200) ÷ £40,000 = 3%.
Notice that customer churn was 5% and gross revenue churn 6%. That tells you the accounts leaving or shrinking are, on average, slightly larger than the base. If the opposite were true, you would be losing mostly small customers, a very different problem.
Be careful with how MRR is measured
MRR itself needs a definition. The Joiin help centre distinguishes billed MRR, which reflects invoiced recurring revenue spread across the days it covers, from run-rate MRR, a forward-looking month-end subscription value. It also treats a customer as churned when the latest paying period ends without a new one, and notes that very recent monthly churn can be provisional because billing gaps sometimes correct themselves. Pick one definition and stay with it.
Revenue recognition matters too. Under IFRS 15, subscription revenue is recognised as the service is delivered, so annual upfront payments create deferred revenue rather than immediate earned revenue, as one UK SaaS due-diligence guide explains. Your churn analysis should reconcile with the accounts, which is exactly what a buyer’s finance team will test. We cover that link in our guide to reconciling MRR to cash.
Method 3: cohort analysis
An aggregate churn rate blends brand-new customers, mature ones and everyone in between. Cohort analysis fixes that. Salesforce describes it as grouping customers by shared characteristics and tracking retention at milestones such as 30, 90 and 180 days. KPI Tree suggests grouping by sign-up month or quarter and following each group through subsequent periods.
What you are looking for:
- Front-loaded churn. Most losses in the first 30 to 90 days point to onboarding, expectation-setting or poor-fit sales.
- Steady lifecycle churn. A constant leak suggests value is not growing with the customer.
- Renewal-event churn. Drops clustered at annual renewal point to price, procurement or lack of demonstrated value.
- Improving cohorts. If newer cohorts retain better than older ones, your fixes are working, even when the blended rate looks flat.
A UK practitioner, Steven Hacking of Latitude, makes the case that looking at each acquisition cohort over time by volume, value and average value shows whether losses concentrate after the first purchase or ease as cohorts mature.
Cohorts without subscriptions
If customers do not cancel, you must infer churn. Shopify UK’s guide suggests estimating the average repeat-purchase interval from order history. Its example uses a three-month interval, follows a January 2022 cohort for six months (twice the interval) and reports 70% churn when 300 of 1,000 customers reordered. The principle carries over to any usage-based or transactional business: define lapse by your own customers’ normal rhythm, not by a generic number.
Our own walkthroughs go deeper on layout and interpretation: see SaaS cohort analysis for better customer retention and the cohort tables covering retention, expansion and payback.
Method 4: customer segmentation
Where cohorts split customers by when they joined, segmentation splits them by what they are. Salesforce lists sign-up date or campaign, industry, company size, contract length and pricing tier, plus behaviours such as login frequency, feature use and support-ticket volume. KPI Tree adds acquisition channel, geography and use case.
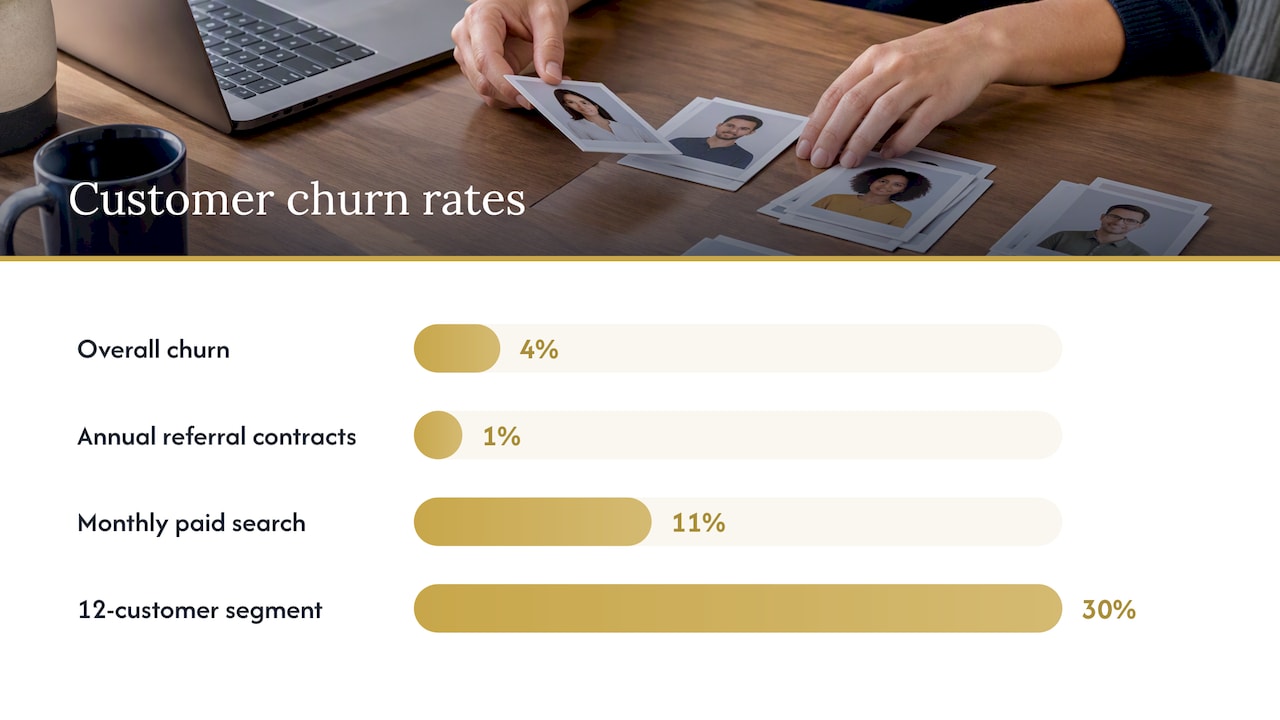
The point is that an average hides the problem. A business with 4% overall churn might have 1% among customers on annual contracts from referrals and 11% among monthly customers from paid search. The second group is where your money is leaking, and perhaps where your acquisition spend is poorly directed.
A practical way to start:
- Pick three or four attributes you already record, such as plan, size band, channel and contract length.
- Calculate customer churn and revenue churn for each segment over the same period.
- Rank segments by the revenue they lost, not just the percentage.
- Check the segment sizes. A 30% churn rate on twelve customers is a prompt for questions, not a conclusion.
Method 5: compare churned and retained customers
A list of reasons from people who left is not a diagnosis on its own. Hacking recommends comparing churned customers with retained customers who experienced the same problems, because the issues most common among leavers may be just as common among those who stay. If slow support response is cited by 40% of leavers and also by 38% of retained customers, it is probably not why people leave.
In practice, build a simple table for a recent period with one row per account and columns for plan, size, channel, onboarding completion, feature adoption, support tickets, payment failures and outcome (stayed or left). Look for the attributes where the two groups genuinely differ. Stripe’s guidance on building a churn model lists usage, feature adoption, support interactions, billing and payment history and customer feedback as the data worth examining.
This method also protects you from a common trap: studying only people who left. Andrew Michael argues in an interview with Martech Family that teams should study successful customers and activation behaviour before leaning on exit surveys. If every customer who retains has connected an integration in week one, that is a more useful finding than any cancellation comment.
Method 6: interviews and exit surveys
Numbers show what happened. Conversations show why. A guide from Glasgow Works presents exit interviews, behavioural product data and cohort analysis as complementary: interviews explain the reasons, behavioural data shows what preceded departure and cohorts show where in the lifecycle patterns occur.
Tips for interviews that produce something usable:
- Talk to leavers and to comparable customers who stayed, as Hacking suggests.
- Ask someone who was not the account owner, so customers feel free to be blunt.
- Ask about the moment they began considering leaving, not only the day they cancelled.
- Code every answer into a short, fixed list of reasons so you can count them next quarter.
- Cross-check against the data. If customers say price but usage had been falling for months, the real story is value.
Method 7: predictive churn modelling
Historical churn rate looks backwards. A churn model looks forward. Stripe’s guide distinguishes the two and describes a model that scores individual customers using signals such as declining usage, complaints and billing problems. The 2025 survey mentioned earlier organises the research literature by model type, and the techniques most often cited include logistic regression, decision trees, neural networks and ensembles.
For most UK SMEs and early-stage SaaS companies, a simple scoring approach is a sensible start: a handful of weighted signals reviewed weekly by customer success. Move to statistical models when you have enough customers and enough churn events to learn from, and when someone owns acting on the output.

If you do build one, evaluate it properly. Stripe lists accuracy, precision, recall, F1, ROC-AUC, confusion matrices and lift, and warns that accuracy alone can mislead when churners are a small share of customers. A model that predicts nobody will churn can be 95% accurate when 5% do, and entirely useless.
Which method answers which question
| Method | Question it answers | Data needed | Best for |
|---|---|---|---|
| Churn rate (customer and revenue) | How much are we losing? | Opening customers and MRR, losses | Every business, monthly |
| Cohort analysis | When do customers leave? | Start dates, retention by period | Spotting onboarding or renewal problems |
| Segmentation | Which customers leave? | Plan, size, channel, contract length | Directing acquisition and product effort |
| Churned vs retained comparison | What differs about leavers? | Usage, support, billing by account | Testing assumed causes |
| Interviews and surveys | Why did they leave? | Conversations, coded reasons | Explaining patterns found in data |
| Predictive modelling | Who is likely to leave next? | Behavioural history, enough churn events | Larger bases with a retention team |
Using the analysis to reduce churn
Analysis only matters if something changes. Stripe’s advice is to use predictions to target high-risk customers with proactive service, personalised offers or other incentives, segmented by characteristics or likely reasons. Then track outcomes and test impact with controlled experiments, measuring churn, satisfaction and profitability. Its underlying perspective is that a model is useful only when its predictions lead to measurable business results, not merely good statistical scores.
A simple operating rhythm works well:
- Monthly: report customer churn, gross and net revenue churn, split by plan, with the compounded annual equivalent.
- Quarterly: refresh cohort tables and segment rankings, and decide the two or three retention bets for the next quarter.
- Per bet: hold back a comparison group where practical, so you know whether the intervention worked.
- Ongoing: feed what you learn back into onboarding, pricing and who sales targets.
Churn also feeds the rest of your finance function. It drives your forecast, which we cover in subscription revenue forecasting, and it sits among the core financial KPIs for SaaS companies. Our SaaS financial benchmarks give context for what good looks like, and our guide to investor-ready SaaS metrics shows how to present the numbers.
Why buyers and investors care how you measured it
Churn is one of the first numbers a due-diligence team challenges, and the way you calculated it matters as much as the figure. If your rate uses a shifting denominator, blends annual and monthly plans, or cannot be reconciled to cash, trust in the whole metrics pack drops. Our guides on how buyers test ARR, churn and revenue quality and on what SaaS due-diligence metrics must prove set out what they look for.
Our perspective: churn is a finance problem as much as a customer one
In our work with founders, the same pattern repeats. Churn gets handed to customer success as a retention target, while the finance side reports a single blended percentage once a month. Neither group can then say why revenue is leaking, and the board is left guessing.
We think the fix starts with definitions and discipline, not tools. Agree what counts as churn, calculate it on an opening cohort, separate customer from revenue churn, and reconcile it to cash and the management accounts. Only then does it make sense to layer on cohorts, segments and prediction. A founder who can show an investor a clean cohort table and explain what changed between cohorts is far more credible than one with a clever model and an unreconciled number.
That is also where a senior finance voice helps most. Someone who has sat across the table in due diligence knows which metrics get challenged and builds reporting that survives it, without the cost of a full-time hire.
— Kishen Patel
Getting senior finance support on your churn numbers
If your churn reporting is inconsistent, or you are heading into a funding round or sale and need metrics that stand up to scrutiny, our fractional CFO services give you ICAEW Chartered Accountant-led oversight of your SaaS metrics, forecasting and board reporting at a fraction of the cost of a permanent CFO. Our FP&A services cover the monthly reporting and analysis that make churn visible and actionable.

If a sale is on the horizon, our financial due diligence preparation tests your numbers before a buyer does. And if you simply need to know what your company is worth given its retention profile, our business valuation service starts from £2,500 one-off.
FAQ
How do you find churn rate?
Divide the customers you lost during a period by the customers you had at the start, then multiply by 100. Leave out anyone who signed up during the period. For revenue churn, use churned MRR divided by MRR at the start.
How often should I run churn analysis?
Report the headline rates monthly if you bill monthly, and refresh cohort and segment analysis quarterly. Choose a period that fits your natural usage and billing cycle, and look at more than one timeframe to see short and long-term trends.
What is the difference between customer churn and revenue churn?
Customer churn counts accounts lost, while revenue churn measures the recurring revenue lost, including downgrades, and can be offset by expansion. A business can lose few customers but a lot of revenue if the leavers are its largest accounts, so you should track both.
Do I need machine learning to analyse churn?
No. Correct calculation, cohorts, segmentation and conversations with leavers and stayers will answer most questions for a smaller business. Predictive models become worthwhile when you have enough customers and churn events to learn from, and a team ready to act on the scores.
Sources
- What is customer churn? | IBM
- A comprehensive survey on customer churn (Taylor & Francis, 2025)
- Churn Rate: Definition, SQL and How to Track It | Metabase
- How should you measure churn? | ChartMogul
- Churn Rate Formula | Amplitude
- How to Calculate Churn Rate | ZoomInfo
- Stripe Connector | Joiin Help Centre
- Series A Due Diligence Checklist for UK SaaS Startups | Glencoyne
- Churn Rate Analysis | Salesforce
- Churn Rate Analysis: Formulas, Benchmarks and Fixes | KPI Tree
- Ecommerce Churn Rate | Shopify UK
- Understanding Churn and Why It’s Happening | Latitude
- How to Build a Customer Churn Model | Stripe
- The counter-intuitive guide to retention with Andrew Michael | Martech Family
- Churn Research for SaaS: Why Customers Leave | Glasgow Works
Recommended
- SaaS Cohort Analysis for Better Customer Retention in 2026
- SaaS Cohort Analysis 2026: Retention, Expansion, Payback
- SaaS Financial Due Diligence: Key Metrics to Prove
- SaaS Financial Benchmarks 2026: Gross Margin, CAC Payback, Churn
This article is for general information only and is not professional advice.
Not sure where your business stands right now?
Book a free 30-minute call with Kish. Bring your numbers, your questions, or just your situation. You will leave with a clearer picture than you arrived with.
Book a Free Strategy Call
Over 12 years across Big Four audit, Investment Banking, and corporate advisory. Kish works with SaaS founders, tech companies, and ambitious UK SMEs from £1M to £50M in revenue on fundraising, valuations, exit planning, and financial strategy. ICAEW regulated. Big Four trained. Based in London.