

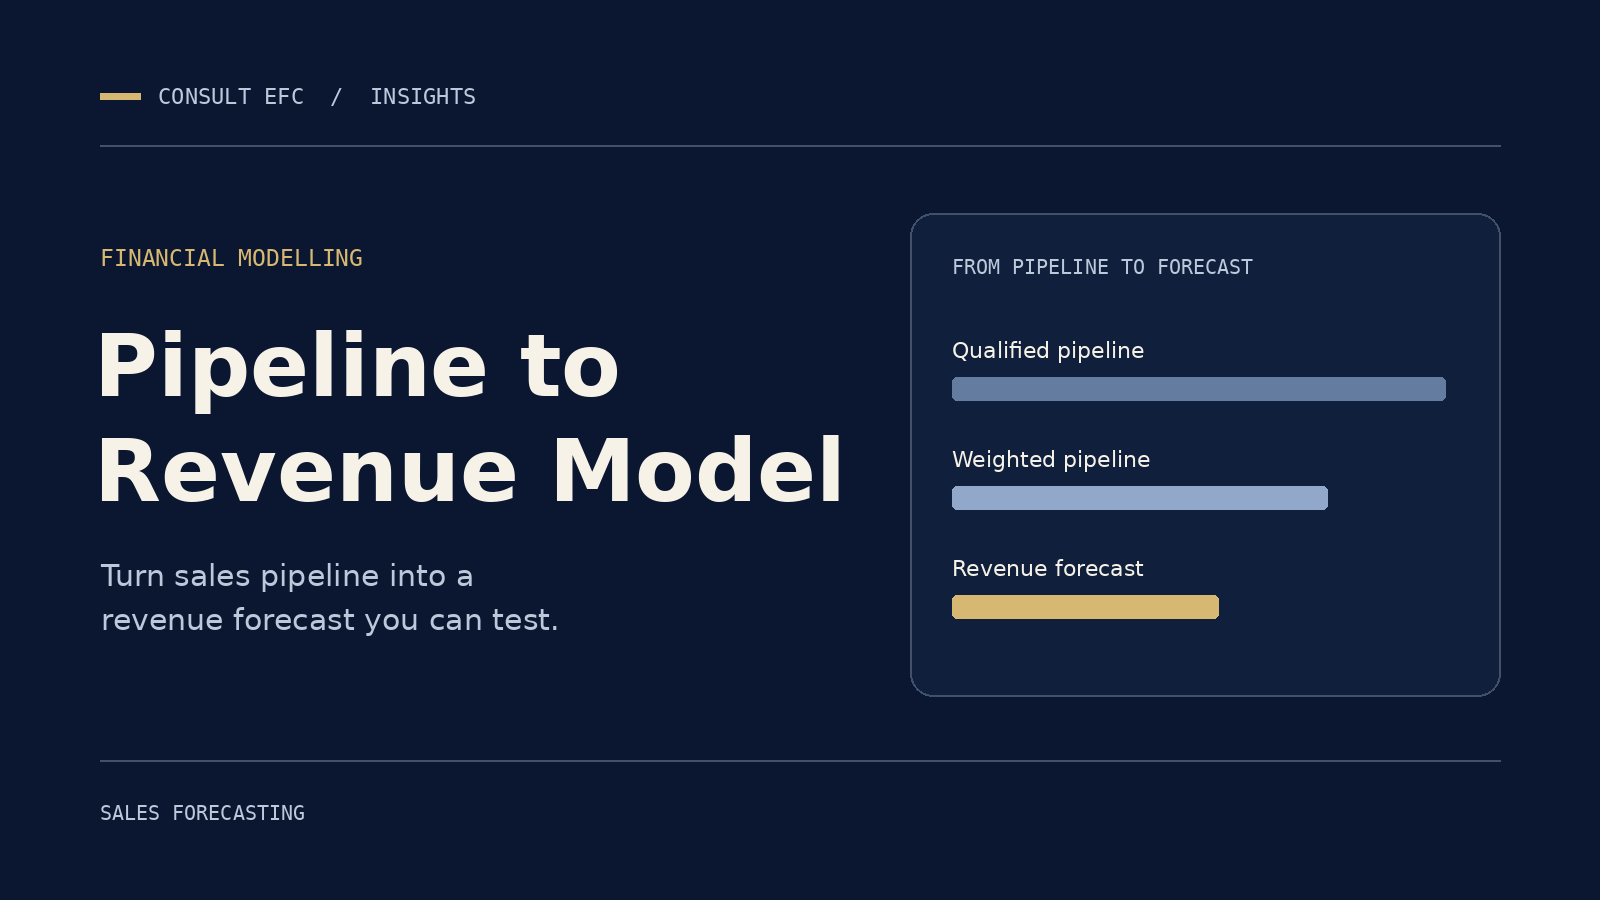
A pipeline-to-revenue model converts the deals you are working into a forecast of cash and recognised revenue, month by month. You take each open opportunity, weight it by the rate at which deals at that stage have actually closed, time it by expected close date, then add contract value to your revenue build. The rest of this guide shows you how, with worked numbers.
The total value of your pipeline is not a forecast. A £500,000 pipeline could hold well-qualified deals or early guesses and stalled conversations, and the headline figure cannot tell you which. The model is what separates the two.
TL;DR
- Weight every open deal by the close rate of its stage, taken from your own closed history, not the default probabilities in your CRM.
- Check coverage (pipeline against target) and sales velocity before you trust any total.
- Time deals by expected close month, then convert bookings to recurring revenue correctly.
- For SaaS, feed new deals into an MRR build that also carries expansion, contraction and churn.
- Compare forecast with actuals every month and adjust stage weights, so the model gets more accurate.
Table of Contents
- What a pipeline-to-revenue model actually is
- Step 1: Define stages with exit criteria
- Step 2: Weight the pipeline with your own close rates
- Step 3: Test coverage and velocity
- Step 4: Time the revenue
- Step 5: Connect the pipeline to MRR, churn and expansion
- Step 6: Reconcile and test against actuals
- Common mistakes
- Perspective: why investors read the pipeline model first
- How we can help
- FAQ
- Sources
What a pipeline-to-revenue model actually is
A sales pipeline is the collection of open opportunities a business is actively working towards a sale. A proper opportunity has an understood need, a credible fit, potential commercial value and an agreed next step. A lead with none of those is not pipeline yet.
A revenue model sits on the other side. It takes those opportunities and answers three questions: how much will close, when, and how that turns into revenue and cash. Research from Warwick Business School on UK SMEs points out that businesses which scale well watch the number of opportunities at each stage, the share moving on, and the speed of movement. Those three numbers are the inputs to everything below.
Pipeline versus funnel
The two terms get swapped, but they describe different views. A pipeline is the seller’s view of specific deals moving through defined stages, while a funnel is the buyer’s journey from awareness to purchase. For forecasting you want the pipeline, because it tracks named deals with values and next steps.
Business model versus revenue model
These are also confused. A business model describes how a company creates value for customers; a revenue model describes how it earns revenue from that value. A SaaS company’s revenue model might be monthly subscriptions with annual prepayment options. The pipeline-to-revenue model is the working spreadsheet that applies that revenue model to deals not yet signed.
Step 1: Define stages with exit criteria
You cannot weight stages that mean different things to different reps. Stage names vary by business, and a typical pipeline runs through lead generation, qualification, proposal, negotiation, closing and post-sale, adjusted to suit your industry. What matters is that each stage has an evidence-based entry rule.
A practical B2B SaaS set looks like this:
- Qualified: need confirmed, budget holder identified.
- Demo or discovery completed: the buyer has seen the product against their use case.
- Proposal sent: price and terms in writing, with VAT shown clearly where relevant.
- Negotiation: legal or procurement involved, a decision date agreed.
- Verbal commit: decision maker has said yes, paperwork pending.
- Closed won or closed lost.
One UK guide makes a point worth building into the rules: a verbal expression of interest is not the same as a completed order. A deal should not move to “commit” because a prospect was friendly on a call.
UK forecasting specialists list the same foundations for accuracy: a consistently applied sales process with explicit milestones, progressive qualification criteria, a CRM that captures the key facts, and salespeople who feel accountable for the number. If your CRM stages are loosely defined, fix that before you build anything else.
Step 2: Weight the pipeline with your own close rates
The core calculation is simple. Weighted value equals opportunity value multiplied by close probability. The forecast is the sum of all deal values, each multiplied by its assigned probability.
The hard part is where the percentages come from. One revenue-planning provider advises that stage weights should come from your own closed history: the share of opportunities that reached a stage and went on to win, over the last four to eight quarters. Another source suggests 12 to 24 months of closed opportunities. Pick the window that gives you enough closed deals to be meaningful; a young company with 20 closed deals should be modest about precision.
The same ORM guidance warns against the probability field a CRM ships with: those values are configuration choices, often set well above the rate a stage actually converts at, which inflates the weighted pipeline.
A worked example
Suppose a UK SaaS company has this pipeline, with stage weights taken from its last six quarters of closed deals (illustrative numbers):
| Stage | Open value | Historical close rate | Weighted value |
|---|---|---|---|
| Qualified | £120,000 | 10% | £12,000 |
| Demo completed | £90,000 | 25% | £22,500 |
| Proposal sent | £60,000 | 40% | £24,000 |
| Negotiation | £40,000 | 65% | £26,000 |
| Verbal commit | £20,000 | 90% | £18,000 |
| Total | £330,000 | £102,500 |
A raw pipeline of £330,000 becomes an expected £102,500 of new annual contract value. That is the number to carry into the revenue build, not the headline. For reference, one vendor guide gives indicative ranges of 10 to 15% at discovery rising to 90 to 95% at verbal commit, but treat those as a sense-check, not an input. Your history beats any benchmark.
Step 3: Test coverage and velocity
Weighting tells you what is likely. Two ratios tell you whether the pipeline is big and fast enough.
Pipeline coverage
Coverage is the total value of active deals divided by the revenue target for the period. In SaaS a ratio of 3x to 5x is typical. If you need £100,000 of new business next quarter and hold £330,000, coverage is 3.3x. A sharper version uses the weighted figure: multiply each open opportunity by its stage close rate, sum the results, and divide by the target. In our example that is £102,500 against a £100,000 target, or 1.03x, which is thin. The raw 3.3x looked comfortable; the weighted view says you have almost no margin.
Sales velocity
Velocity shows how fast pipeline turns into revenue. Sales velocity is the number of opportunities multiplied by average deal value and win rate, divided by sales cycle length. With 40 opportunities, a £15,000 average deal, a 25% win rate and a 60-day cycle:
(40 × £15,000 × 0.25) ÷ 60 = £2,500 of new contract value per day.
The formula also tells you where to act. Improving the number of opportunities, the conversion rate or the speed will drive top-line growth, and the WBS research recommends regular, action-focused pipeline meetings to do it.
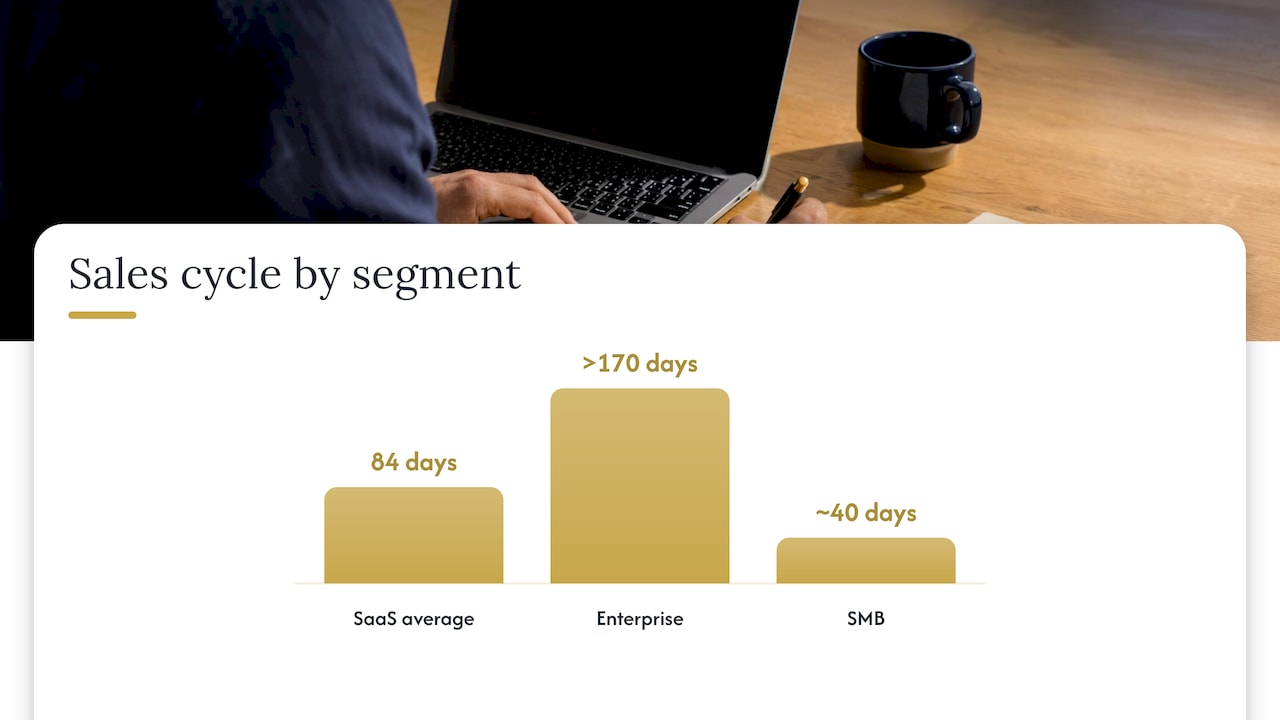
Cycle length matters for timing too. One source puts the average SaaS sales cycle at 84 days, with enterprise deals above 170 days and SMB deals around 40. Use your own cycle by segment, because a blended average will misplace revenue by months.
Step 4: Time the revenue
A deal that closes in March does not produce March revenue for its full value. Build a timing layer with three parts.
- Expected close month. Time by close month rather than by quarter; timing by quarter is one of the two adjustments most teams skip.
- Go-live or billing start. Add the usual lag between signature and first invoice, such as onboarding or notice periods.
- Conversion of bookings to recurring revenue. A three-year contract booked at $300,000 in total is $100,000 of ARR, and multi-year deals with escalators need the first-year value, not the average.
If you prefer a lighter method for in-quarter calls, one forecasting guide uses three categories: Commit, Best case and Pipeline. Commit means the buyer has verbally agreed, the decision maker is engaged and pricing is agreed. It is a useful overlay on the weighted number for the current month.
Step 5: Connect the pipeline to MRR, churn and expansion
For a subscription business, new deals are only one line in the revenue build. The standard monthly roll-forward is beginning MRR plus new MRR plus expansion MRR minus contraction MRR minus churned MRR equals ending MRR. The pipeline forecast supplies the new MRR line. Everything else comes from your installed base.
Three habits keep that base honest:
- Lay out renewal dates. A blended churn rate applied evenly is wrong every month because renewals cluster. List contracted renewal dates with the ARR attached, then apply cohort-level rates by segment and tenure.
- Forecast contraction separately. Downgrades often precede full churn by a renewal cycle, so folding them into churn hides an early warning.
- Keep it driver-based. Compute revenue from acquisition, conversion, churn, expansion and average revenue per account rather than pulling a top-down growth rate from the air. We cover this build in more depth in our SaaS financial model components guide and our piece on SaaS forecasting from pipeline to cash.
Worked example: from £102,500 to monthly MRR
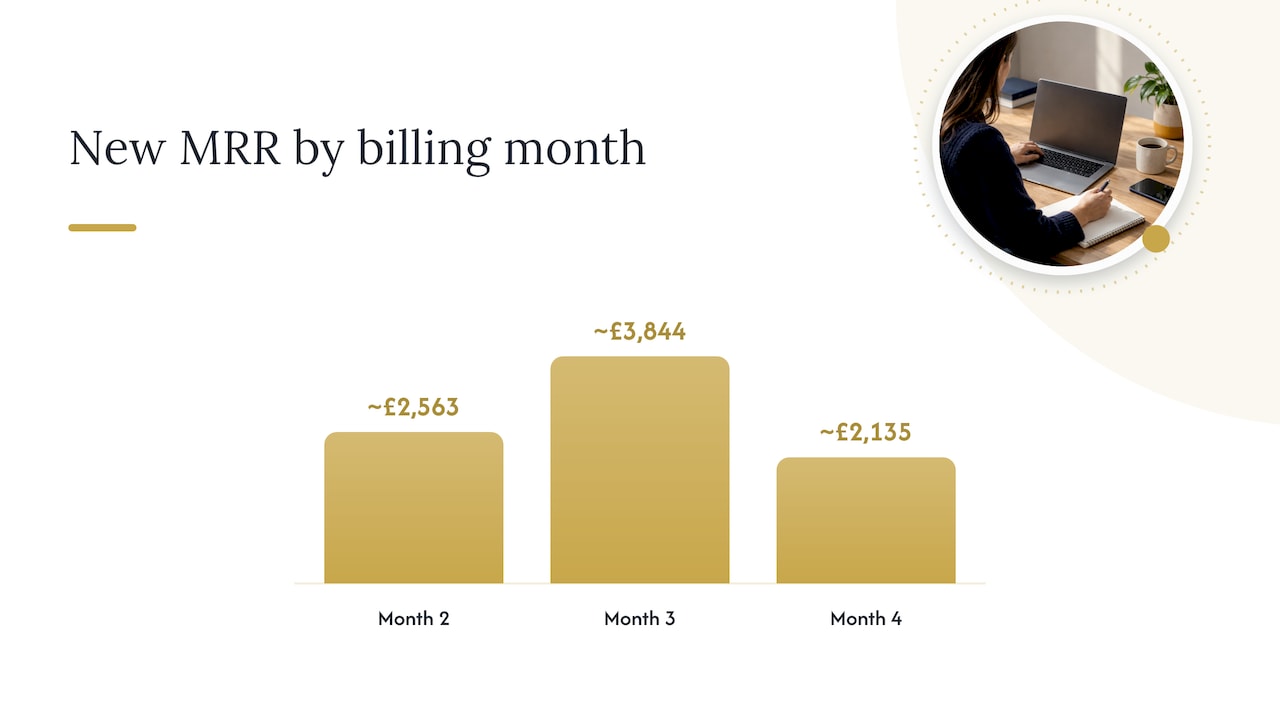
Take the weighted £102,500 of annual contract value. That is roughly £8,542 of MRR if everything lands (£102,500 ÷ 12). Spread by expected close month, say 30% in month one, 45% in month two and 25% in month three, and apply a one-month billing lag. Month two then adds about £2,563 of new MRR, month three about £3,844 and month four about £2,135. Add expansion and subtract contraction and churn from the base, and you have ending MRR for each month.
Acquisition mix matters as well. Paid, outbound and content pipelines convert and slip differently, so a sensible model carries separate assumptions per source. If your spend is channel-heavy, a customer acquisition and retention strategy helps you tie each pound of acquisition spend to revenue actually realised rather than to lead volume.
Step 6: Reconcile and test against actuals
A model that is never checked drifts. Four checks keep it honest.
- Reconcile to finance. Beginning ARR plus expansion minus contraction must equal ending ARR, and ending ARR must match recurring revenue in your accounts. A gap usually means a miscategorised deal, a wrongly annualised multi-year contract or a contraction booked in the wrong month.
- Cross-check the two views. If the weighted pipeline implies more revenue than your assumptions model, one of them is wrong. Resolve the difference, because that is where you learn.
- Refresh often. The same source suggests updating the pipeline sheet weekly or after significant deal movement.
- Recalibrate weights. Each quarter, rebuild stage close rates from the latest closed deals, then compare forecast against actual by stage and by source. If proposals consistently close at 30% against your 40% weight, change the weight.
Report the output as a range, not a point. A base case, a downside with lower close rates and longer cycles, and an upside give your board or investor a floor and a ceiling. Our financial modelling and forecasting guide sets out three sales scenarios in detail.
Common mistakes
- Treating total pipeline as forecast. Unweighted value ignores stage and quality.
- Using default CRM probabilities. They reflect opinion, not results.
- Stale deals. Opportunities with no confirmed next step should be dropped or reduced, not kept at full weight.
- Mixing bookings and revenue. Contract value, ARR, billings and recognised revenue are four different numbers.
- Ignoring seasonality. Renewals and buying cycles cluster, so spread them by actual date.
Perspective: why investors read the pipeline model first
When founders come to us ahead of a raise or a sale, the pipeline model is often where the story is won or lost. An investor or buyer will rarely argue with a large pipeline number. They will ask how it was weighted, how long deals really take, and whether the forecast has tracked actuals.
Our view is that a pipeline-to-revenue model should be built bottom-up from your own conversion history, tied to MRR, churn and cash, and reconciled to the management accounts every month. That discipline is what turns a sales forecast into investor-ready financials.
This is exactly where a fractional CFO adds value. You get senior finance judgement and the rigour of a larger firm’s methods, applied to your numbers, without hiring a full-time finance director before you need one.
Kishen Patel
How we can help
If your forecast lives in a spreadsheet nobody fully trusts, we can rebuild it. Consult EFC is led by ICAEW Chartered Accountant Kishen Patel, and our fractional CFO services give high-growth companies and ambitious UK SMEs senior financial leadership without the full-time cost.

For the model itself, our investor-grade financial modelling links pipeline, MRR, costs and cash into one forecast, and our FP&A services keep it updated month by month. If a raise or exit is on the horizon, we can also help you prepare the metrics for financial due diligence. Visit Consult EFC to start a conversation.
FAQ
What does pipeline mean in business?
Pipeline is the portfolio of current sales opportunities a business is working. It shows how many opportunities sit at each stage, how many move on and how fast. It is the seller’s view of deals in progress.
What are the stages of a sales pipeline?
Common stages run from prospecting and qualification through meeting, proposal and negotiation to contract signing and post-purchase, as set out in a widely used CRM guide. Rename them to fit your sales process, as long as each has clear exit criteria.
How do you calculate weighted pipeline revenue?
Multiply each opportunity’s value by the historical close rate of its stage, then add the results. For example, a £60,000 deal at a stage that closes 40% of the time contributes £24,000. Take close rates from your own closed deals, not CRM defaults.
What is the difference between a business model and a revenue model?
The business model explains how you create and deliver value to customers. The revenue model is the part describing how that value turns into income, such as subscriptions, usage fees or one-off sales.
Sources
- Warwick Business School: why turning sales into a process can boost UK SME performance
- Leads, meetings, pipeline and revenue explained
- Manufacturing sales pipeline guide (NetSuite UK)
- Business model versus revenue model
- What is a sales pipeline and why have one (Unbiased)
- Sales pipeline stages: a practical UK guide
- Sales forecasting methods, part one (SalesSense)
- Weighted pipeline: how to forecast sales revenue
- Pipeline forecasting for SaaS (Abacum)
- How to calculate weighted pipeline coverage (ORM)
- Sales pipeline visualization guide (Prospeo)
- Sales velocity (HubSpot)
- How to build an ARR forecast model (ORM)
- Sales forecasting methods compared (SalesBlog)
- SaaS sales forecast template (Stackrows)
- What is a sales pipeline? (Salesforce)
Recommended
- SaaS Forecasting 2026: Pipeline to Cash, Runway, Hiring
- Revenue Model Financing: Fund Rental & Service Growth
- From Guesswork to Growth: How a Financial Model Becomes Your Business’s Strategic Roadmap
- SaaS financial model components: 2026 founder guide
This article is for general information only and is not professional advice.
Not sure where your business stands right now?
Book a free 30-minute call with Kish. Bring your numbers, your questions, or just your situation. You will leave with a clearer picture than you arrived with.
Book a Free Strategy Call
Over 12 years across Big Four audit, Investment Banking, and corporate advisory. Kish works with SaaS founders, tech companies, and ambitious UK SMEs from £1M to £50M in revenue on fundraising, valuations, exit planning, and financial strategy. ICAEW regulated. Big Four trained. Based in London.